Create a hexagonal map
09 Dec 2018 • 0 Comments
Introduction
It is now a technology that should not be used because of the risk of hacking because of security vulnerabilities, but about 10 to 15 years ago Flash created the best web contents. JavaScript has not yet set the right standards, so the code you need to write for browsers such as Explorer, Chrome, and Opera has changed a bit. To increase productivity, we needed a tool that would produce the same results on all browsers, and that was Adobe’s Flash.
A lot of games are made in Flash, and I would like to draw Dice wars as one of the masterpieces. This game is a great game that combines neat vector graphics, clear strategy, and simple yet convincing game rules. If you are interested, I suggest you try it. Fortunately, the author has created a version that also runs on html5. Today, I try to reproduce the part of the game that makes the battleground random map.
Hexagonal grid
The random map of Dice wars consists of small hexagons. To create a hexagonal map, I have to explain the hexagonal grid. Amit Patel of Red Blob Games wrote a very detailed Resources on the Responsive Web about this subject. This blog is one of the pages at the top of my favorites because it is full of other useful content.
Amit Patel has done a lot of research on hexagonal grids and then put together a simple way to implement a grid. First, the hexagonal grid can be classified into two broad categories: the flat top of the cell (flat topped) and the pointed top (pointy topped). Depending on how you define the coordinates, you can classify them into four types: Offset, Doubled, Axial, and Cube. Each coordinate system can be converted to another.
I mainly use the Cube coordinate system. The Cube coordinate system is a representation of a two-dimensional hexagonal grid with three axes, X, Y, and Z. In this coordinate system, it is easy to rotate and vectorize, and symmetry around the origin (0, 0, 0) can be easily obtained.
The following code creates the hexagon as a class using the javascript function. Javascript Ninja written by John Resig who create jQuery separates the function from the constructor as follows:
Functions and methods are generally named starting with a verb that describes what they do (skulk(), creep(), sneak(), doSomethingWonderful(), and so on) and start with a lowercase letter. Constructors, on the other hand, are usually named as a noun that describes the object that’s being constructed and start with an uppercase character; Ninja(), Samurai(), Ronin(), KungFuPanda(), and so on. - 「Javascript Ninja」, 54p.
After defining HexCell in this way, you can create a HexGrid consisting of HexCell.
In line 1 of initGrid(5), 5 is the unit of measure that represents the radius of the HexGrid. In other words, 5 is the distance from the center (0,0,0) to the HexCell farthest from the center. If you change 5 to a different number, you can see that the HexGrid is changing.
Create a region
Returning to the map of Dice wars, you can see that one map is divided into several regions. And this area is composed of several HexCells each. If so, you may need an array or object that holds each HexCell non-overlapping. We will use object here.
But how do you organize these areas? If we think of a simple procedural method, we can randomly assign 0 to N-1 IDs to all HexCells, then use the Schelling Segregation Model to get the same cells to be contiguous.
Thomas Schelling is an American economist who won the Nobel Prize in economics. He established theory on how segregation of settlements occurs through game theory. This theory is simply a mathematical model of the phenomenon of minority races finding and migrating to similar races when different races live together. This is called the Schelling Segregation Model.
Here are some links you can see: here, and my previously created program. However, my program is a Flash version because it was created a long time ago.
The two links above cover the segregation model on a rectangular grid. It will also be possible on the hexagonal grid. First, add a race in HexCell.
The next step is to actually change the color of each HexCell depending on the race.
Changing line 1’s raceCount changes the type of race each cell can have.
Now let’s apply the Schelling Segregation Model. Simply count the number of neighbors in each cell, and if there are too few neighbors with the same race, move to any empty cell. Repeat this process until all the cells are satisfied.
let happyNeighborCount = [0, 1, 1, 2, 2, 2, 3];
happyNeighborCount defines the minimum number of identical race neighbors needed to be satisfied when the number of neighbors in the cell is 0 to 6. If the number of cells in the same race is less than happyNeighborCount, it becomes unsatisfactory and moves to the empty cell.
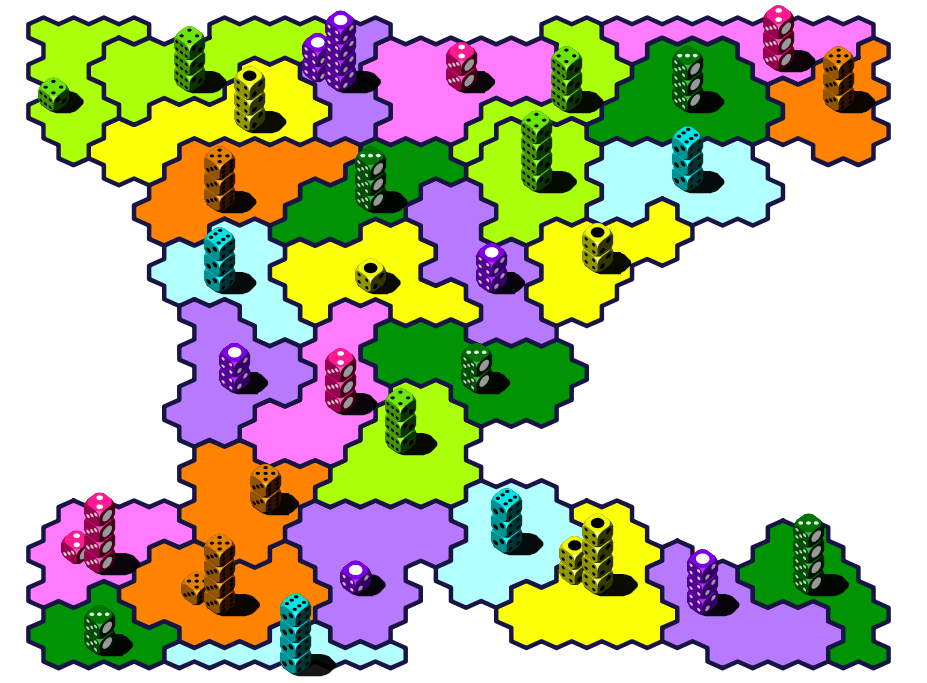
If you keep pressing the “1 Step Segregation” button, the satisfaction will converge to 100%. When we combine the same colors, it looks similar to the area we saw in Dice wars.

This way, the map of Dice wars can be created in an iterative way using the Schelling Segregation Model. But the creator of Dice wars seems to have used a different method. If you are interested, you can refer to the make_map() function section of Open source.
Now it’s the second post, and writing the markdown seems to be a pretty tough job. Furthermore, I tried to write an interactive element that could not be done in egloos. It seems to be a rewarding thing though. Later, if I have some time to spare, I’ll be blogging about implementing the interactive code in the jekyll blog. It took too long to implement because there were not enough resources. Thank you for reading the long article.